Visually Build and Explore The Schema
TLDR; Just watch this video 📺
Traditionally, data was recorded on paper, which was an effective method for preserving information and retrieving it later. With the transition to computers, pen and paper were replaced by screens, mice, and keyboards. Despite these changes, we retained traditional concepts, simply transferring them to the new medium. We continued to use Word (or its alternatives) to simulate sheets of paper, and we maintained tightly organized data in spreadsheets like Google Sheets (or Excel). Only recently have we begun to adapt our working processes to the new environments in which they exist.
The paper had a fixed and limited size; therefore, we needed a way to compact data into tables. As the amount of data grew, we made adjustments, allowing our spreadsheets to expand, and created SQL to keep different tables connected. This works well as long as the data follows a few simple rules: the data is simple (mainly numeric), consistent, and relatively fixed in structure, isn’t very sparse (imagine working with an Excel table with thousands of columns where each rarely has a value), and the data doesn’t have many connections or the connections are simple. Yet, we kept the data in box-like shapes even though much of our data doesn’t follow these rules. For example, an event can trigger other events in a chain reaction of unknown length in advance, or we need to assemble a group of people each with various properties (e.g., skills and characteristics), and make predictions about the group that should take the interactions into account, but each group is somewhat different and sometimes dynamic in size, and the interactions have a dynamic nature. We do have the data to make these predictions, but trying to box it will flatten it, and much will be lost. Moreover, many systems are built to serve us as humans, but using so many tables is not how we as humans think. In many cases, we are associative and perceive the world as a set of entities (physical actions, events, etc.) and the relationships between them. Each of them we tend to associate with an “a priori template” (basic schema) we start with and evolve over time. Even in the software development domain (which, compared to the regular layman, has so much more freedom when working with computers), we use object-oriented programming (OOP) and domain-driven design (DDD) for our day-to-day work, but when it comes to data, we still keep the data in boxes (slowly breaking it with NoSQL solutions).
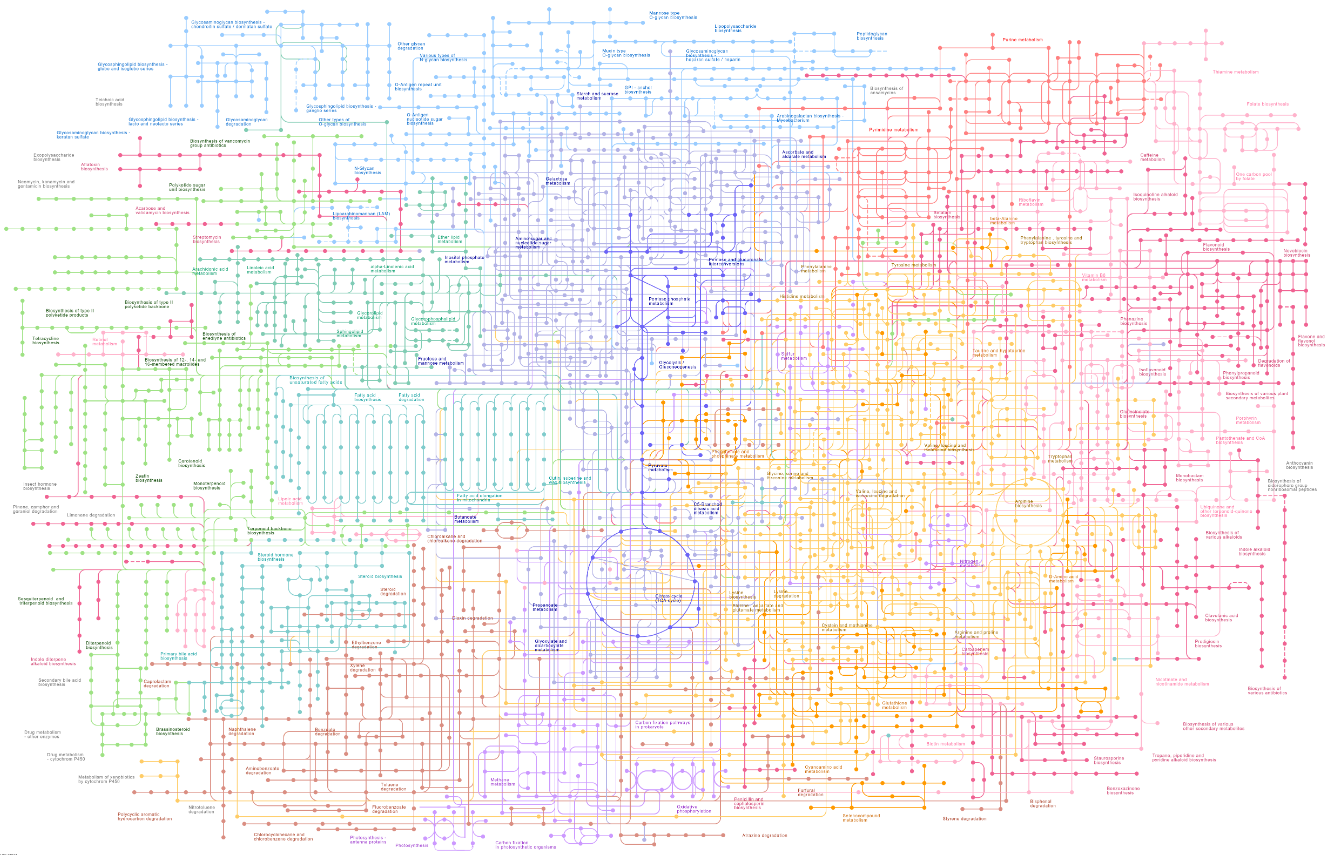
A solution to align the data model with the mental model has been known for a long time but faces another constraint of pen and paper—it is hard to change things on paper. So even if your paper was limitless and you tried to draw all the entities and relations, it would start by looking like the drawing below and quickly become more complicated.
 *The image was taken from KEGG metabolic pathway
It is possible to work with such a model (I have managed to extract a few very useful insights from it), but it is not the best or most convenient way to work. Having the ability to explore the data and display only the data I need when I need it would have helped—a lot.
So, I began exploring what it would take to enable us to work with an “unboxed” data model (you are invited to approach me if you have requirements or ideas you would like to share and possibly see implemented). The first piece of this puzzle is to define a schema for the data. A schema allows us to understand the data and maintain consistency even upon first encountering a new dataset. However, a schema must be flexible and allow us to easily evolve our data model.
To better explain, let’s dive into a specific example of a small business that imports and sells garden products. We will focus on its marketing efforts: We start with the entity of a user, who can make a purchase of a product. We also know that before making any purchase, the user will make at least one review of the product on our website. This review can be “organic” or through some reference. In our example, we’ll start with a simple scenario where a reference can either be through a post on Facebook that redirects to the product’s page or through a coupon that each user who buys a product receives and can give to a friend. How should our data model look?
This example illustrates how easily one can understand the structure of data from an existing schema or create a new one. The schema creation was done with GraphExplorer (suggestions for a better name are welcome). While the development of schema creation is progressing rapidly, it is not yet fully completed, and I am looking for design partners (contact me if you would like to help evolving and influence the product).
In the next post, I will further extend our example and demonstrate various queries that can be performed on our data model and would be challenging in other databases. I’ll also showcase a few more cool features, so stay tuned.
Thank you for reading this far, and if you find it interesting, please recommend it to others. Think it could help you? Drop me a line, and let’s discuss your challenges to see if I can help you create value.
