Table of Contents
- Part I - What is graph data and why would you want to use it?
- Part II - So what is a hypergraph?
- Part III - Working with TypeDB
- Part IV - Summary
Part I - What is graph data and why would you want to use it?
Why use graph data? Why hypergraphs? Why my preference for TypeDB?
These intriguing questions were recently posed to me, sparking a journey of reflection. Until now, my journey with these technologies had been intuitive and problem-driven. I often found myself naturally gravitating towards them as the optimal solution among various alternatives. This fresh perspective, however, turns the approach on its head – beginning with the solution and tracing back to the problem. Embracing this new angle, I’m excited to delve deeper into these questions and share my insights along the way.
A few years ago, I stumbled upon the advantages of working with graph data. I could suddenly easily model and solve problems that were once hard to solve.
But the real game-changer was when I encountered TypeDB. This database had everything I had been yearning for in my previous experiences with graph databases (at the time I was using JanusGraph for production, and NetworkX, and Neo4J for prototyping). With TypeDB, I found I could accomplish in a month what had previously taken six senior Java developers more than half a year.
So, join me on a journey to understand why I’m so passionate about graph data and why TypeDB is my go-to choice.
Since it is the first time I am writing about graphs I will start at the beginning, by discussing what graph data is and introducing the concept of a hypergraph.
First things first, if the mention of ‘graph data’ brings to mind dots connected by lines or thoughts of X and Y axes, take a moment to pause, please. You’re headed in the wrong direction.

Graph data is a method of storing and managing data. But what does that really mean? Let’s skip the distant origins and fast forward to a time when we began creating tables on paper. Later, we transitioned to using spreadsheets like Excel and Google Sheets. As we progressed, we started connecting these tables, with one table containing product attributes, including an ID, and another table referencing this product ID to the full set of specific product attributes. We even developed a language, SQL, to extract data from these interconnected tables, and in most cases, it worked quite well and continues to do so. However, this approach still traces its roots back to the days of manually writing rows on paper.
But here’s the catch: this isn’t how humans naturally think. Our thought processes tend to be more associative. In our reality, data isn’t composed of isolated data points neatly arranged in independent rows of a table. Each data point carries context and connections to numerous other elements. Often, each data point can fit into one or more hierarchies of concepts we generalize upon. Many of the valuable insights we humans gain occur when we step outside the assumption of independent data points and explore the structures and patterns that data creates.
I mention ‘we as humans,’ but in this new era of AI, these advantages are equally relevant to machine learning. Generalization enables us to work with less data and swift adaptation to new information while we continue to accumulate more information and improve our models. Placing data in context helps us grasp its significance and trustworthiness, and identifying patterns, and understanding whether something fits into a specific pattern, is a key tool in our toolkit.
Utilizing graph data simplifies the modeling process, resulting in faster development and easier maintenance, and improves pattern recognition outcomes across various tasks. Often, based on the specific use case, this approach can also significantly enhance performance.
With graph data, we usually have 3 main types of things:
- Entities/Nodes/Vertices.
- Relationships/Edges.
- Attributes (that describe the entities and relationships).
Usually, these are enough to go a very long way to describe our world.
Let’s take a simple example:
“John Doe” is an entity, he has multiple describing attributes (he is content, his hair is brown, etc.,) and he has many relations to other entities (location, family members, people he met this month, and whatever else that comes to your mind).
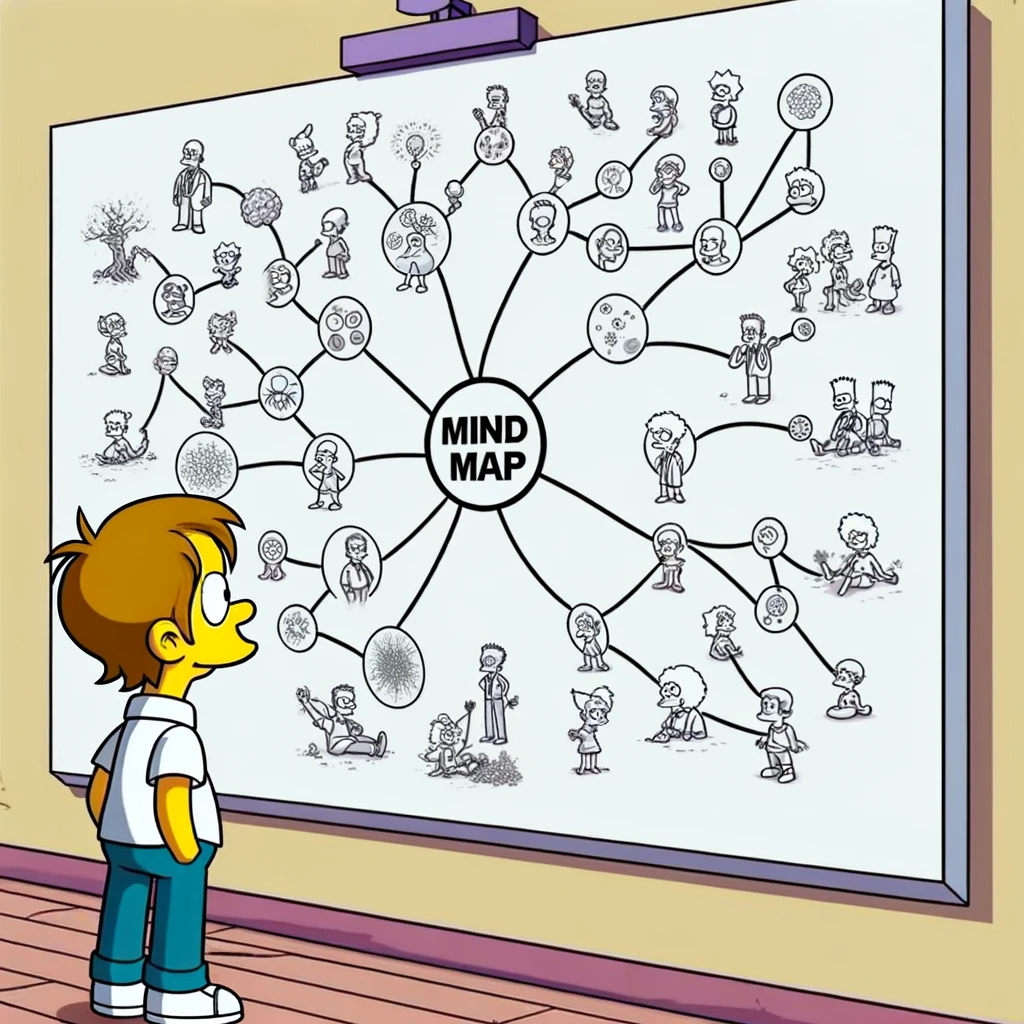
That’s the essence of graph data. For a long time, working with data in this way posed significant challenges. It was a capability mostly reserved for tech giants like Google, Facebook, Microsoft, and others. However, in recent years, our technology has evolved, simplifying the handling of graph data. In the past, there were only a handful of reliable vendors offering graph databases, and even then, their implementations often lacked the expressive power needed.
Today, the landscape is shifting, and for many tasks, working with graph data is becoming more natural than trying to fit everything into traditional tables. This field is experiencing rapid growth as more top professionals discover the potential of graph data and embark on the learning curve.
In the next part, we will review what is a hypergraph and what it adds to our modeling abilities.
Curious about which industries are leveraging graphs and for what purposes? Follow me or_ Sign up to receive future updates. If you’d like to request a review for your specific industry, you can reach me here on LinkedIn or via the following Contact Us _form and share your thoughts.
Part II - So what is a hypergraph?
A hypergraph is like an advanced version of a graph. In a regular graph, you have entities connected by relationships, and each relation links between exactly two entities. A hypergraph expands on this idea. Instead of relationships connecting just two entities, a hypergraph allows for “hyperedges”, a relation that can connect any number of entities. It’s like having a line that can join three, four, or more points together, not just two. This lets you represent more complex relationships, where a connection can involve several entities at once. This is especially useful in situations where interactions aren’t just one-to-one but involve groups of elements interacting together. It’s a more advanced way to model and analyze complex networks and relationships.
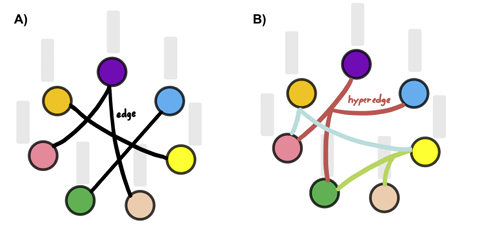
Image from Lostar, M., & Rekik, I. (2020). Deep hypergraph U-Net for brain graph embedding and classification.
On the left part (A) there is a simple undirected graph, where an edge connects a pair of nodes.
On the right side (B) there is a hypergraph, where a hyperedge connects more than two nodes. While an edge captures the low-order interaction between graph nodes, a hyperedge captures a high-order between nodes as a set.
Let’s look at a few examples that will help to make it clearer.
Consider a hypergraph model in pharmacology where entities represent drugs - Drug A, Drug B, and Drug C. Hyperedges in this example Indicate drug interactions and their effects. In this example we will assume:
- Hyperedge 1: This relation connects Drug A and Drug B and the effect of this interaction which might be, for example, increased efficacy or a specific side effect.
- Hyperedge 2: Links Drug B and Drug C. The interaction here could lead to a different effect, like reduced efficacy or a mitigated side effect.
- Hyperedge 3: This relation encompasses Drugs A, B, and C together while the interaction might result in a unique effect that only occurs when all three drugs are used simultaneously, like a synergistic therapeutic effect or a new side effect.
In this example, we used the hypergraph to easily represent groups of entities and use them natively in our models.
Another path to take is to look at the relation as having its meaning only when relating to multiple entities, each filling in a specific role.
Let’s review a specific example like a transportation network involving passengers (P), drivers (D), and vehicles (V).
- Hyperedge 1: Connects Passenger P1, Driver D1, and Vehicle V1, indicating that Passenger P1 requested a ride from Driver D1 using Vehicle V1.
- Hyperedge 2: Links Passenger P2, Driver D1, and Vehicle V1, representing a different ride request.
- Hyperedge 3: Connecting Passenger P3, Driver D2, and Vehicle V1, signifying another unique ride request.
Here, introducing a hypergraph simplifies this representation by directly modeling the triadic nature of ride requests. It makes it clear that a ride request involves three key elements: the passenger, the driver, and the vehicle.
Another example can be modeling a very simple supply chain where purchases involve parts, suppliers, and shipments. Each purchase is depicted as a hyperedge that seamlessly connects the part, supplier, and shipment. This approach elegantly represents the 3-ary relation and conveys that the purchase itself has no meaningful interpretation without considering all three entities together. It simplifies modeling complex relationships and provides a more accurate representation of the intricate dynamics within the supply chain. We will use this simple example later on to examine various aspects of graph data modeling and its advantages.
Does it mean these models cannot be modeled by SQL? No, they can be modeled, but as your demands grow, the SQL model rapidly becomes more complex, and the equivalent of the compact graph data schema becomes an endless number of SQL tables. A simple graph query equivalent in SQL becomes much longer, more complicated, and error-prone, and pressing forward becomes slower and slower. Then you start to scope your dreams of what can be done with your data to what is within easy reach. Graph data can take you further and get more from your data.
Do you think what you read here is cool and can help you with your challenges? Would you like some help or training for integrating this technology into your team? Contact me for details.
Part III - Working with TypeDB
In the previous sections, I discussed the concepts of graphs and hypergraphs, providing insights into why I prefer using them. However, I reserved the explanation of TypeDB and my reasons for utilizing it for this part. This section will be more technical, but I aim to make it accessible and engaging for those without extensive software development knowledge. It includes code examples, which are designed to be straightforward. Don’t worry if you don’t completely grasp the code; I plan to create a future post titled “TypeDB 101,” which will guide you through getting started with TypeDB in 30 minutes.
So What is TypeDB?
TypeDB is a specific database implementation of hypergraph but it has a few other features that make it so much more. I can talk about type safety, inference, polymorphism and so but I think an example will be a simpler way to make it clearer.
I will reuse the example I gave before of modeling a (very) simplified supply chain.
We will start by creating a simple schema where one part can be built from other parts and has 3 attributes (name, description, and serial number).
Such a simple schema will have this visual representation.
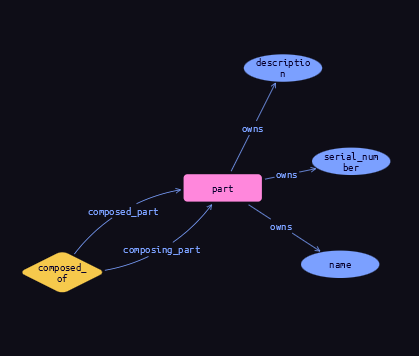
Making such a definition is simple and looks like this:
# 👉 Lines starting with '#' are remarks for clarity

define


# Creating a relation with the name composed_of, this relation have two roles (edges) composed_part and composing_part

composed_of sub relation,
    relates composed_part,
    relates composing_part;


# Defining the part as an entity, the entity can take both roles of composed_of relation

part sub entity,
    plays composed_of:composed_part,
    plays composed_of:composing_part,
    owns name,
    owns serial_number @key,
    owns description;


# Defining the attributes we are using

name sub attribute, value string;
serial_number sub attribute, value string;
description sub attribute, value string;
The details are not as important as the impression one needs to take, which is, that there is no rocket science to understand what’s going on here. Along this one can understand there is a schema to the data in TypeDB and each thing has a type. This explicit schema is important because it keeps the data well-defined and validated instead of a free-style graph that sometimes is used. Its importance will also reveal itself when combined with other features we will review later on as a way to reduce the gaps between what the developers use (OOP) and how the data is stored.
Inserting some actual data for part of a Laptop and a Desktop will create the following visualization (This data is not trying to be complete but just enough to explain things).
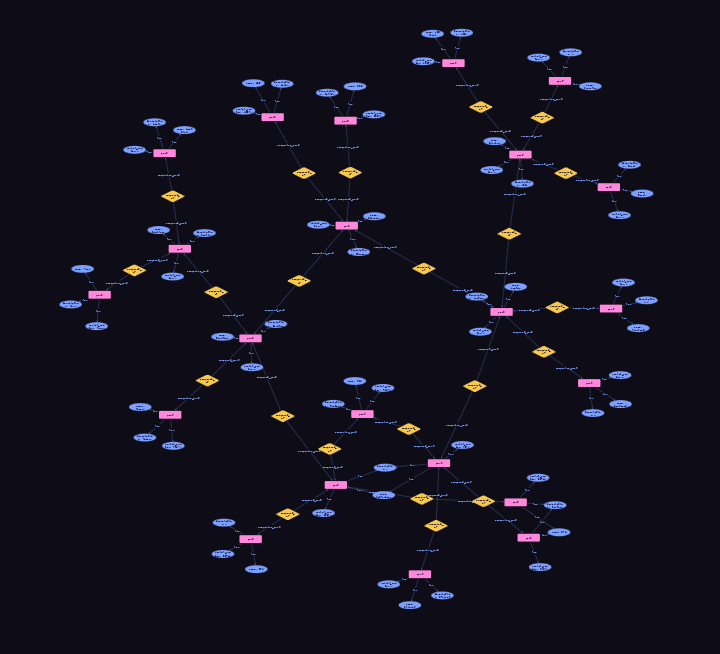
The parts for a Laptop (which is in itself a part) are:
- Motherboard
- CPU (Central Processing Unit)
- RAM (Random Access Memory)
- Chipset
- Display
- LCD Panel
- Inverter
- Bezel
- Storage Device
- SSD (Solid State Drive)
- HDD (Hard Disk Drive)
- Input Devices
- Keyboard
- Touchpad
Notice that The Laptop is composed of multiple parts Motherboard is one of them, which in itself is composed of multiple parts. In reality, such connections can go much deeper.
Query this data by asking are the direct sub-parts of a laptop, Will look like as follows:
match
  $prd isa part, has name "Laptop";
  $prt isa part, has attribute $prt_attr;
  (composed_part:$prd, composing_part: $prt) isa! composed_of;
get $prt, $prt_attr;
Reviewing these few lines will show us it is quite simple to understand.
- We defined a part with the name “Laptop” and saved it into a “variable” called $prd. Notice that $prd is not really equivalent to a variable but more like an answer to a constraint.
- We define a part and save it into $prt. This part has various attributes that are stored in $prt_attr
- We defined a relation of type composed_of that has $prd and $prt taking roles in it.
- We asked to return to us every part entity (and its attributes) that satisfies the constrain matching part.
The visualization of this query will look like this:
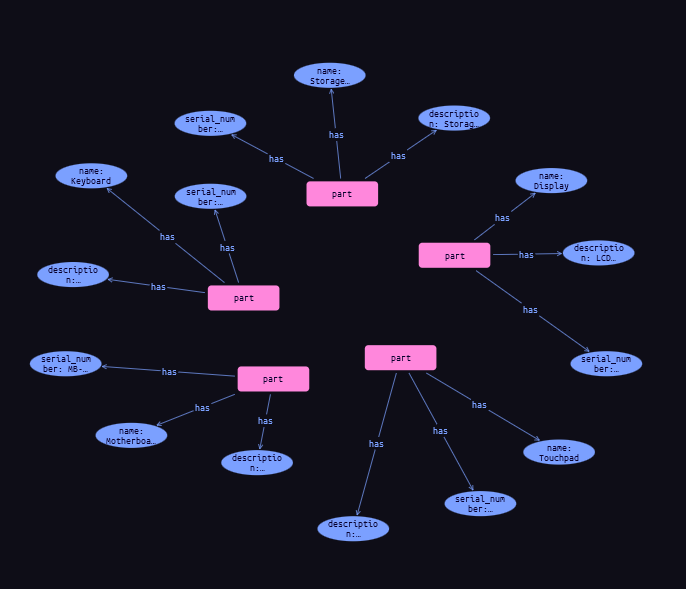
I think this query was simple to understand but now comes another useful feature I love in TypeDB, which is inference. I now added to our model schema the following:
define
  # Create a new entity that is a "sibling" of composed_of
  inferred_composed_of sub composed_of;

  # Create a Transitivity rule for parts composition
  rule composed_of_transitivity:
    when {
        (composed_part: $x, composing_part: $y) isa composed_of;
        (composed_part: $y, composing_part: $z) isa composed_of;
    }
    then {
        (composed_part: $x, composing_part: $z) isa inferred_composed_of;
    };
This rule will create an inferred_composed_of relation between entity X and entity Z if X is composed_part of Y, and Y is composed_part of Z (transitive relation).
Now a Chipset which is a part of a Motherboard is also part (by inference) of a Laptop as the Motherboard is part of the Laptop. This same rule would apply and allow us to ask questions deeper into the data even if we had more levels of depth in our data as rules can rely on rules’ implications. We can also add more rules and different rules’ results may “feed” other rules (I will call it chaining of rules). Such rules can be adding inferred relations or as simple as adding an inferred attribute to mark parts that are basic parts (not composed of other parts - if it was a tree data structure we would have called them leaves) and a rule to mark with a product attribute for parts that nothing is composed of them (e.g., Laptop, Desktop) then a rule to mark parts that are leaves and belong to multiple products maybe as “highly important”. All of this is inferred data and will adapt automatically as the data changes (more parts are added or removed). Suddenly hard to retrieve data becomes easy to reach with simple queries.
This is a very strong feature that works well for me. The alternative in SQL would have been making numerous recursive queries that frequently depend on each other (lots of round trips) resulting in a very slow response time and much greater complexity.
Another thing I like about TypeDB it is easy to extend the schema and so I keep my flexibility through the development process (and afterward). Let us continue our example and add a relationship of purchase between the supplier and the product.
define

part sub entity,
    plays purchased:provided_part;

supplier sub entity,
    plays purchased:provider,
    owns name @unique,
    owns address,
    owns contact_number;

purchased sub relation,
    relates provider,
    relates provided_part,
    owns purchase_date,
    owns quantity,
    owns price;

address sub attribute, value string;
contact_number sub attribute, value string;
purchase_date sub attribute, value datetime;
quantity sub attribute, value long;
price sub attribute, value double;
I effortlessly expanded the ‘part’ entity in TypeDB by introducing a ‘purchased’ relationship, enabling it to fulfill the role of a ‘provided_part.’ Additionally, I introduced a ‘supplier’ entity along with relevant attributes to enhance the comprehensiveness of the example.
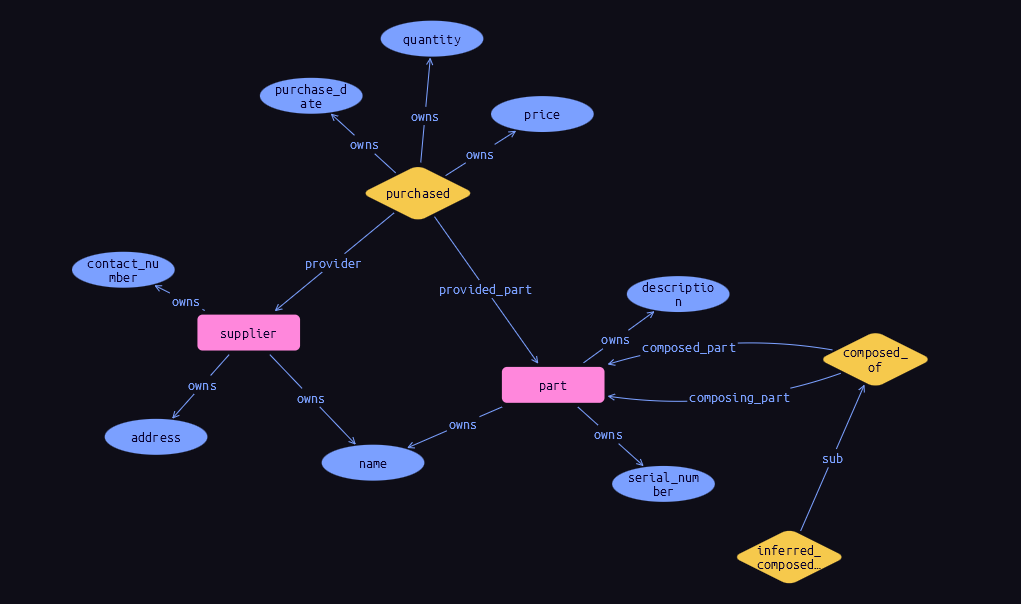
Now, with the inserted data, I can effortlessly execute a query to retrieve all the suppliers of a particular product. This query leverages the transitive inference we just established and identifies the suppliers of these parts, which are essentially standalone components (the ‘leaves’).
match
    $prd isa part, has name "Laptop";
    (composed_part:$prd, composing_part: $prt) isa composed_of;
    not {
        (composed_part:$prt) isa composed_of;
    };
    (provided_part:$prt, provider:$supplier) isa purchased;
    $supplier isa supplier, has attribute $sup_attr;
get $supplier, $sup_attr;
Now, let’s further enhance our model by introducing shipments to each purchase, thereby creating a 3-ary relationship. However, to make it even more intriguing, we’ll elevate shipments to a relationship in their own right, effectively connecting one relation to another. This transformation can be accomplished quite easily, as follows:
define
  shipment_company sub entity,
      plays shipment:shipper,
      owns name @unique,
      owns headquarters_location,
      owns contact_number;

  shipment sub relation,
      relates shipper,
      relates shipped_purchase,
      owns shipment_price,
      owns departure_date,
      owns arrival_date;

  purchased sub relation,
      plays shipment:shipped_purchase;

# ... Attributes definition ...
Resulting in the following schema:
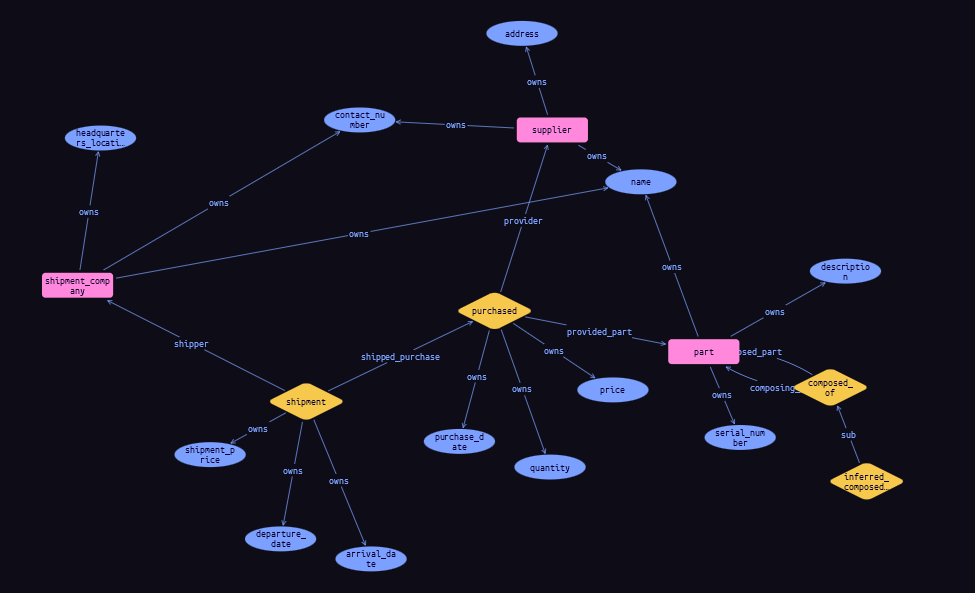
This modeling capability, which allows us to use N-ary relations (hypergraph) and even connect one relationship to another, provides an extensive range of modeling options and unmatched flexibility.
The last part I will mention here briefly is TypeDB Polymorphic capabilities. TypeDB was made to support Object Orient Programming (OOP) principles and it is possible to define for an entity, relation, or attribute what it extends. This feature, as I see it, has a few major advances that include significantly simplifying data modeling in various scenarios and closing the gap between the application and logic layers and the data layers. Just think that you can work with a package like Pydantic to define your classes (including inheritance) and have an identical data model in the DB.
How does it help?
You may already noticed that I already used sub to extend entities even utilizing it to ask only for the exact type (by using isa! ) of the composed_of relation and ignore its subtypes (inferred_composed_of).
Consider another scenario where we need to expand our model to accommodate various types of shipments, such as air_freight, sea_freight, express_delivery, and rail_freight. These shipment types share common attributes like location and capacity, but they also possess unique properties that distinguish them from one another. To illustrate this extension, let’s take a closer look:
⚠️ Ahead is a longer, somewhat repetitive piece of code. Remember to take a breath at least once in the middle.
define

    handled_by sub relation,
        relates handling_entity,
        relates handled_shipment;

    # Base Entity for Common Attributes
    transport_hub sub entity,
        plays handled_by:handling_entity,
        owns location,
        owns capacity;

    airport sub transport_hub,
        owns airport_type,
        owns international_code;

    seaport sub transport_hub,
        owns port_type,
        owns harbor_size;

    railway_station sub transport_hub,
        owns station_code;

    # Extend shipment subtypes
    shipment sub relation,
        plays handled_by:handled_shipment;

    air_freight sub shipment,
        owns flight_number,
        owns weight,
        owns size;

    sea_freight sub shipment,
        owns vessel_name,
        owns weight;

    express_delivery sub shipment,
        owns tracking_number;

    rail_freight sub shipment,
        owns railway_bill_number;

    location sub attribute, value string;
    capacity sub attribute, value long;
    size sub attribute, value string;
    weight sub attribute, value double;
    flight_number sub attribute, value string;
    vessel_name sub attribute, value string;
    tracking_number sub attribute, value string;
    international_code sub attribute, value string;
    station_code sub attribute, value string;
    airport_type sub attribute, value string, regex "^(Commercial Airport|Cargo Airport|General Aviation Airport|Hub Airport|Regional Airport|International Airport|Domestic Airport|Military Airport|Private Airport|Reliever Airport)$";
    port_type sub attribute, value string;
    harbor_size sub attribute, value string;
    railway_bill_number sub attribute, value string;
Now our schema will become more interesting. We can see we have subtypes for the shipment relation and the transport_hub entity.
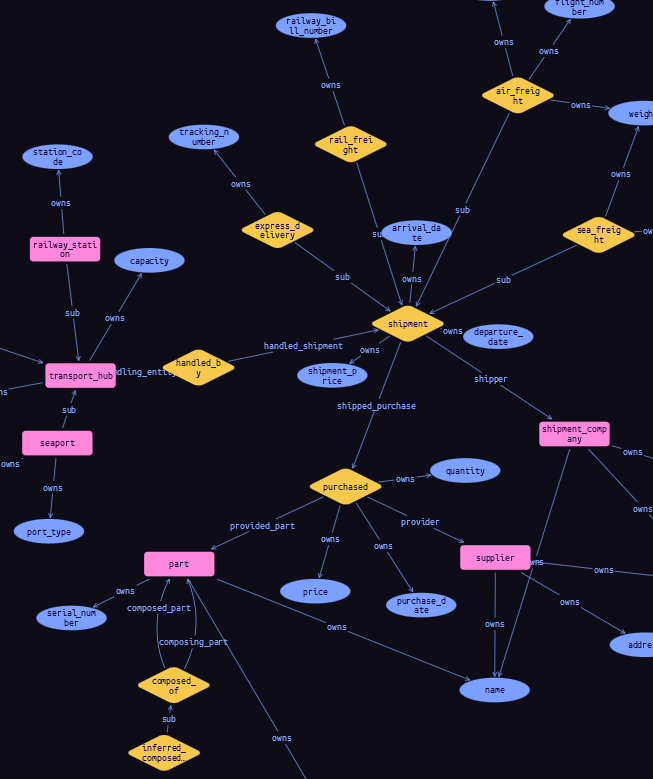
To truly grasp the strength of this feature, it’s worth considering how you would model this data using SQL tables and the complexity of the resulting SQL query. Imagine the task at hand: retrieving departure and arrival dates for various parts of a Laptop that are shipped using multiple shipment options. In the SQL world, this would involve numerous queries and join operations. Now, think about the performance impact when dealing with a substantial number of parts and a deeper supply chain.
As you attempt to create a status report for multiple parts, you may find yourself making optimizations to the SQL model to improve performance. However, the frustration sets in when you realize that these optimization efforts become irrelevant over time. The constant need to adapt queries as the data evolves makes this process cumbersome and slow.
In contrast, with TypeDB, such complex queries become simple and efficient
I hope you now understand why I appreciate working with TypeDB and hope you will give it a try.
How would you use such capabilities for your use cases? Have a unique challenge and need help to kickstart? let’s chat and see if I can help you.
Is TypeDB a flawless solution? Certainly not. Like any software, there’s always room for improvement, and there are features I’d love to see added in the future.
Are there alternatives to TypeDB? Absolutely. The world of databases is vast, and there are other Graph DB products out there, such as Neo4j, Amazon Neptune, and OrientDB, among others. In the past, I conducted a thorough comparison of these options, and at that time, TypeDB emerged as the winner despite its own set of challenges, which have since been addressed. It could be intriguing to revisit this comparison in the future.
Is TypeDB suitable for every data modeling problem? No, it’s not a universal solution. The choice of database should always align with the specific needs and characteristics of the problem at hand. Each problem is unique, and the selection of a database should be driven by a deep understanding of the problem’s nuances.
In terms of TypeDB’s continuous improvement, it’s worth noting that as it evolves, my expectations of it also grow. While it may not be perfect, its ongoing development keeps me very optimistic about its potential while I enjoy its current capabilities.
In summary, the choice of a database should always be a thoughtful decision, tailored to the particular challenges and requirements of the task. TypeDB, with its strengths and ongoing improvements, remains a valuable tool that I enjoy using for relevant problems.
To conclude this section, we’ve delved into several distinctive features of TypeDB and their potential to offer significant advantages in data modeling. In the upcoming and final part of this series, I’ll provide a summary of when graph data should be a consideration (and when it shouldn’t), and we’ll summarize the specific features of TypeDB that we’ve explored here, illustrating its unique capabilities in the field of data management.
Part IV - Summary
This final section serves as a wrap-up, summarizing the core questions we’ve explored throughout this series. We started by delving into the significance of utilizing graph data and the advantages it offers. Then, we delved into the concept of hypergraphs and their role in representing complex relationships, providing a deeper understanding of why they are valuable.
In the third part of this series, we shifted our focus to TypeDB and why I have a strong affinity for this database implementation. We discussed its unique features and how they contribute to effective data modeling and analysis.
To conclude this series, let’s summarize the key points we’ve covered:
Why and when would you should consider the use of a graph database?
- The data have lots of relations between the various entities or the relationships themselves add lots of useful information.
- Your queries need to join and traverse through many big tables.
- There are hierarchies in the data or deep connections (which require recursive queries).
- You think that the “structural patterns” in the data have meaning (e.g., there are repeating subgraphs that have meanings, the importance of a data point is related to its surroundings).
- You want to be able to easily relate and add context to the various entities and relationships.
- You have a clear use case for using an inference engine like the one TypeDB has.
- You know you will want/need to use graph algorithms to extract more insights from your data.
- You already perceive your data as a graph and are highly comfortable with the concept.
- You want to keep the data easy to work with and evolve the schema.
When not to use graph database?
- If your current solution works well and you’re considering graph data just because it’s a trend.
- When the data is simple, and entities are mostly independent.
- If you need a production-grade solution by yesterday, you don’t have any prior experience with graph databases (or lack support from someone experienced) and even the usefulness of using graph data is not crystal clear to you.
The features we reviewed for why use TypeDB,
- An explicit schema that’s easy to extend while keeping data well-defined and validated.
- The ability to define inference rules, ensuring insights are always updated and easily accessible through simple queries.
- A user-friendly query language.
- Support for hypergraphs and the ability to connect relationships to relationships.
- A polymorphic schema that simplifies data modeling and querying while bridging the gap between data and logic layers.
As I see it, all of these open many new challenges and great opportunities.
A few of these challenges and opportunities
-
Adapting the existing Graph Algorithms and Graph ML frameworks to work with hypergraph and relation to relation and fully utilize the additional data.
-
Building the (Bayesian) algorithms by fully exploiting the polymorphic schema and building a hierarchical probabilistic inference engine as stand-alone or to enrich Graph ML algorithms (especially for new or relatively rare sections of the data).
-
Automatically (and smartly) utilizing the inference engine for graph machine learning algorithms. This includes creating great pre-processing steps for generating new rules automatically to simplify and improve the training process.
-
Creating an amazing OGM (and adaptation from ORM but adapting the Relational part to Graph 😀).
-
Building visual insights miner.
There are many more challenges and opportunities avenues and some are already in the work. If you find a need for any of these you are welcome to share your use case with me (privately or publicly). Also, please approach if want to collaborate in tackling any of these challenges or have a solution and want to discuss where it can make an impact and who may find value in it.
As we wrap up this series, I invite you to stay tuned for additional content, and please feel free to share your preferences on my website and follow my blog.
Is there specific related content you’d like me to create in the future? Your feedback and ideas are always welcome!
Thank you for making it this far. I hope it has been both interesting and valuable to you.
